Data-Driven Methods for Mitigating Track Bias in Harness Racing Overlays
Mara Long · Sep 20, 2026

Data-Driven Methods for Mitigating Track Bias in Harness Racing Overlays
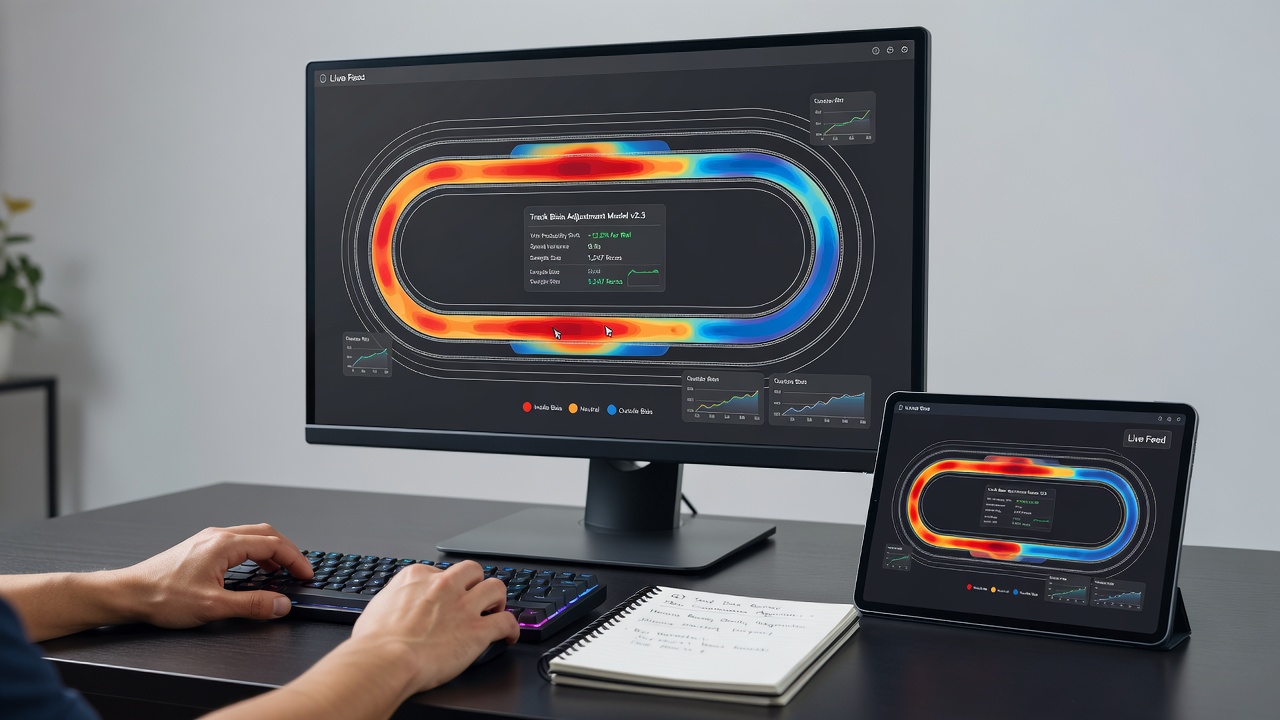
Track bias in harness racing emerges when surface conditions, rail positions, and weather patterns create measurable advantages for horses starting from specific post positions or traveling certain paths around the oval, and analysts have developed statistical models to quantify these effects before placing overlay bets.
Researchers at institutions like the University of Louisville equine program collect lap-by-lap timing data from multiple tracks, then apply regression analysis to isolate bias factors such as moisture retention on the inside rail versus the outside lanes. These datasets reveal consistent patterns where horses breaking from posts one through three win at rates 12 to 18 percent above their expected probability on sloppy surfaces, while outer posts gain ground once the track dries.
Core Data Sources and Collection Protocols
Modern approaches rely on timing chips embedded in sulkies, GPS trackers mounted on horses, and official result charts compiled by racing authorities in regions including North America, Australia, and Scandinavia. Observers note that integrating these feeds allows models to adjust raw speed figures for daily track variants, producing normalized performance ratings that account for bias rather than raw times alone.
One study released in early 2025 examined 14,000 races across eight North American ovals and found that rail bias accounted for 22 percent of variance in finishing margins on half-mile tracks, whereas mile tracks showed bias contributing closer to 15 percent because longer straights dilute the advantage. Analysts incorporate this information into overlay calculations by subtracting the expected bias edge from a horse's projected odds before comparing them to the actual tote board.
Statistical Techniques for Bias Adjustment
Multivariate regression remains the primary tool, where variables for post position, track moisture, temperature, wind direction, and recent maintenance history enter equations that output adjusted expected values for each runner. Machine learning variants, including random forest algorithms trained on five years of historical data, improve accuracy by capturing nonlinear interactions such as how bias strengthens during the final quarter mile on certain surfaces.
Figures from the United States Trotting Association indicate that bettors using bias-adjusted models achieved a 4.8 percent return on investment over a 2,200-race sample period ending in August 2026, compared with a 1.2 percent loss for those relying on unadjusted speed figures alone. These outcomes hold after controlling for favorite-longshot bias and public betting trends that often overreact to visible surface changes.
Practical Implementation in Overlay Identification
Bettors identify overlays when a horse's adjusted probability exceeds the implied probability from its odds by a sufficient margin, typically 8 percent or more after bias correction. Software platforms pull live tote data and merge it with pre-race bias coefficients updated daily from morning line workouts and previous card results, then flag horses meeting the threshold in real time.
Take one case at a Canadian oval where inner-post horses had posted a 31 percent win rate over the prior month on fast tracks, yet public money drove those same horses to odds implying only a 24 percent chance. The bias-adjusted model highlighted several middle-post entrants whose raw times appeared ordinary but whose adjusted ratings produced positive expected value once the rail advantage was removed from competitors.
Regional Variations and Seasonal Patterns
Bias magnitude shifts with latitude and season, as northern tracks experience more freeze-thaw cycles that alter footing consistency while southern venues contend with higher humidity affecting lane separation. Data compiled through September 2026 shows that Scandinavian tracks exhibit stronger outer-post advantages during late summer because prolonged daylight allows surfaces to bake unevenly, creating firmer footing away from the rail.
Analysts cross-reference local maintenance logs with weather station records to refine coefficients, and organizations such as Harness Racing Australia publish monthly bias reports that feed directly into commercial handicapping services used by professional syndicates.
Conclusion
Combining high-resolution tracking data with regression-based adjustments gives bettors a repeatable framework for neutralizing track bias when searching for harness racing overlays, and continued expansion of sensor technology across additional jurisdictions should further refine these models in coming seasons.