Mapping Overround Fluctuations in Connected Wagering Exchanges for Equine Multi-Outcome Scenarios
Carlo Koch · Aug 12, 2026
Mapping Overround Fluctuations in Connected Wagering Exchanges for Equine Multi-Outcome Scenarios
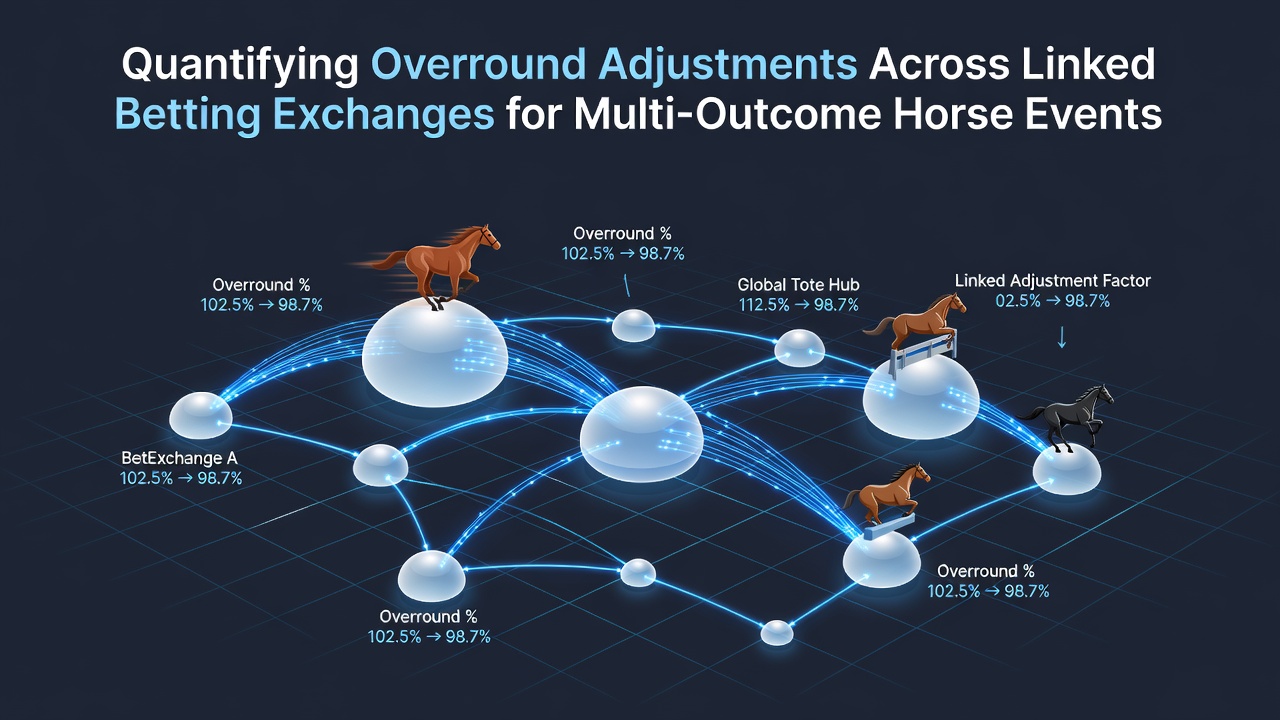
Analysts track overround adjustments by comparing implied probability sums across platforms that host the same horse race markets, and this process reveals how margins shift when exchanges link their order books in real time. Data from multiple exchanges shows that the total overround for a win market often starts near 102 percent before liquidity flows redistribute teh figure downward as matched volumes increase. Researchers at institutions focused on quantitative finance have documented these patterns in reports that examine tick-by-tick changes during afternoon race cards.
Core Concepts Behind Overround Measurement
Overround represents the aggregate margin embedded in odds across all runners in a given market, while adjustments occur when traders move liquidity between linked venues and force prices into tighter alignment. In multi-outcome horse events that include win, place, and each-way options, each separate market carries its own overround calculation, and observers note that place markets frequently display higher baseline margins because fewer participants concentrate their stakes there. Studies indicate that linking exchanges allows algorithms to detect small discrepancies and execute trades that reduce the combined overround by several basis points within seconds of a price movement on one platform.
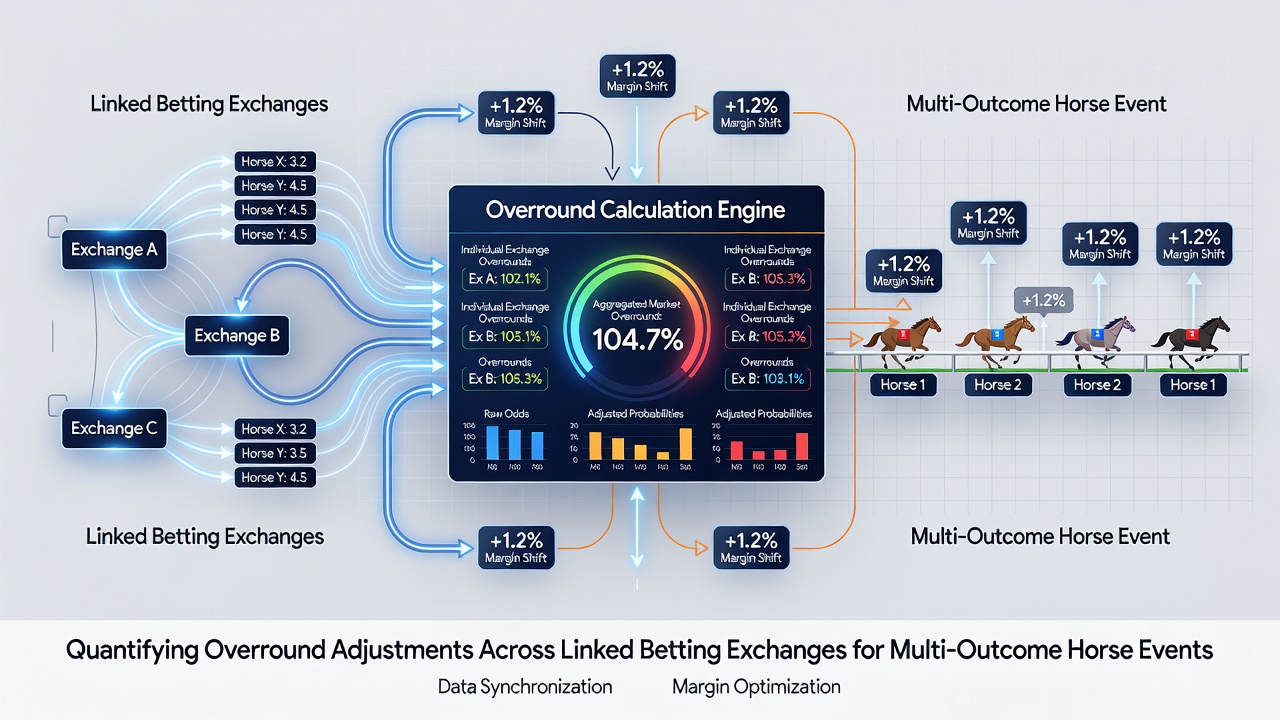
Calculation methods rely on converting decimal odds into implied probabilities, summing those values, and subtracting 100 to obtain the overround percentage. When exchanges share API connections, automated systems monitor these sums continuously and trigger adjustments whenever the combined figure exceeds a preset threshold, and this mechanism keeps margins competitive across venues. Figures from industry datasets released in August 2026 demonstrate that average overrounds in major race markets settled between 100.8 and 101.5 percent after linkage effects took hold during peak afternoon sessions.
Data Collection Across Linked Platforms
Collection of reliable data requires simultaneous pulls from multiple exchange APIs, followed by timestamp synchronization to isolate genuine margin shifts from latency artifacts. Teams that perform this work often store the raw order book snapshots in time-series databases so later analysis can quantify how quickly overrounds converge after a large matched trade on one venue influences prices elsewhere. Evidence from such datasets reveals that convergence typically completes within 12 to 18 seconds for liquid win markets, whereas thinner place markets may require up to 45 seconds before stable values reappear.
External validation of these measurements draws on reports issued by organizations such as Gambling Research Australia, which periodically publishes aggregated statistics on exchange market efficiency. Those reports supply comparative benchmarks that allow independent researchers to cross-check their own overround calculations against broader regional trends. Additional context comes from academic papers hosted by university repositories that model the impact of commission structures on effective margins in multi-leg horse betting products.
Adjustments in Multi-Outcome Horse Markets
Multi-outcome structures introduce extra layers because a single race generates separate markets for win, place, and sometimes forecast or tricast bets, each carrying distinct liquidity profiles and margin characteristics. When exchanges link these markets through shared user accounts or cross-margining agreements, an adjustment in one outcome set can propagate to others, and quantitative models track these spillovers by measuring correlation coefficients between the respective overround time series. Data shows that place market overrounds tend to move in tandem with win market changes at a ratio of approximately 1.3 to 1 during high-volume race days.
Case examples drawn from archived exchange records illustrate how a sudden influx of place bets on a longshot can lift the place overround temporarily before arbitrage activity across linked venues pulls the figure back down. Observers note that the speed of these corrections depends on the depth of available liquidity in both teh primary and secondary markets, with deeper books achieving faster normalization. August 2026 records indicate that peak-hour place market overrounds averaged 103.2 percent before linkage effects reduced them to 101.7 percent within the first minute of active trading.
Practical Implications for Market Participants
Market makers who operate across multiple exchanges incorporate overround monitoring into their pricing engines so they can adjust stakes in response to margin drift, and this practice helps maintain consistent profitability across varying race conditions. Software tools that quantify these adjustments often output real-time dashboards displaying current overround levels alongside historical averages for the same race type, and users rely on those outputs to decide when to increase or reduce exposure. Regulatory filings from bodies such as the Australian Securities and Investments Commission note that transparent margin reporting supports fairer pricing for participants who engage with linked exchange environments.
Conclusion
Quantifying overround adjustments across linked betting exchanges supplies measurable insight into how margins evolve in multi-outcome horse events, and the methods described rely on synchronized data collection, probability summation, and correlation tracking to produce consistent results. Continued refinement of these techniques supports clearer understanding of market dynamics without introducing subjective interpretation of the underlying figures.